 |
Chris Bell | 'A business that makes nothing but money is a poor business.' |
| - Henry Ford |
 |
Chris Bell | 'A business that makes nothing but money is a poor business.' |
| - Henry Ford |
SNHU - IT-420 Advanced Information Systems Implementation
Written by: Chris Bell - August, 2014
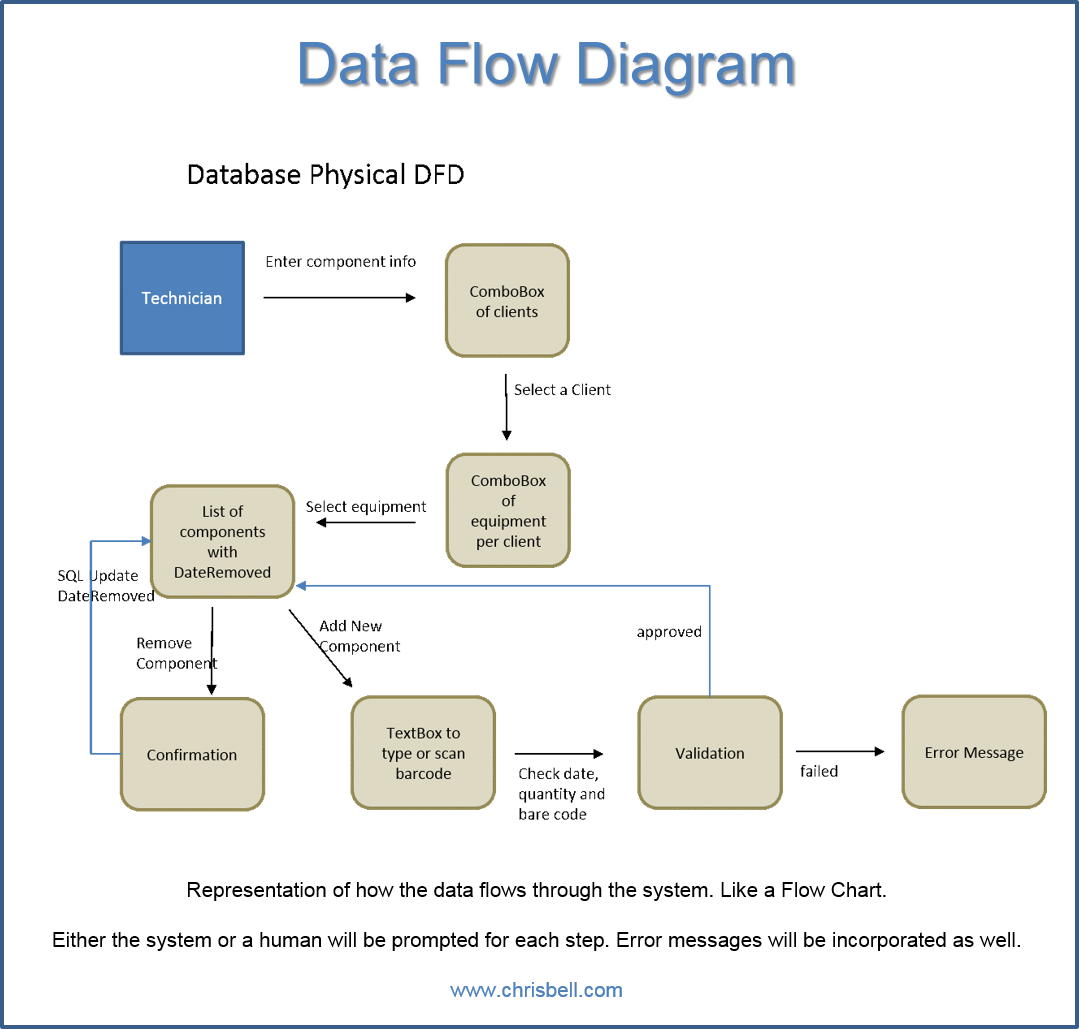
The DFD (Data Flow Diagram) is a visual tool used to see how the data is flowing throughout the company. For instance, when a technician enters a component into the system, it will ask the technician which client it's for first. Then the system will ask the user to select the equipment that the component will be used in. From that point there are validations, confirmations and error-checks to make sure that the user remembered each part of the process. The data needs to flow smoothly and consistently through the system in order to use the system to its fullest potential.

The Network Data Flow Diagram is much easier to read. The user enters a service request that is intended for a technician. The request sits in spreadsheet format known as SQL (Structured Query Language), until it's called upon. For instance, you can create an Excel sheet, save it to your desktop, and ask that it pops-up on a certain date and time. This is a similar process in a different spreadsheet. Once the request is sitting in SQL, an event (Event Diagram) is created to alarm the technician on a selected date and time.

References:Whitten, Jeffrey L., & Bentley, Lonnie D. (2007). Systems analysis and design methods, 7th edition. Boston, Mass.: McGraw Hill. |